Bạn đang ôn luyện cho kỳ thi IELTS và gặp khó khăn với dạng bài Writing Task 1 Line Graph? Bài viết này sẽ cung cấp cho bạn tổng hợp các bài mẫu IELTS Writing Task 1 Line Graph được biên soạn chi tiết, giúp bạn dễ dàng chinh phục dạng bài này trong kỳ thi.

I. Bài mẫu IELTS Writing Task 1 Line graph – Đề 01
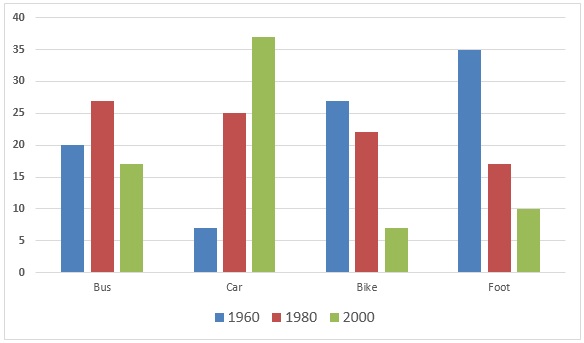
Đề bài: The line graph below shows the number of people using different modes of transport in a city between 2010 and 2020.
Bài mẫu:
The line graph illustrates the number of individuals utilizing various transportation modes within a city from 2010 to 2020. It is evident that the popularity of private cars has declined over the decade, while the usage of public transportation and bicycles has increased.
In 2010, private cars were the most prevalent mode of transportation, with approximately 50,000 users. Public transportation usage stood at 30,000, while cycling was the least popular option, with only 10,000 users.
Over the next five years, the trend of private car usage began to decline, reaching 40,000 users by 2015. In contrast, public transportation experienced a steady rise, reaching 40,000 users in the same year. Cycling also witnessed a moderate increase, with 15,000 users in 2015.
From 2015 to 2020, the downward trend for private car usage continued, with the number of users dropping to 30,000 by 2020. Public transportation remained stable at 40,000 users throughout this period. Cycling, however, showed the most significant growth, reaching 25,000 users in 2020.
In conclusion, the line graph highlights a shift in transportation preferences within the city from 2010 to 2020. Private car usage has decreased, while public transportation and cycling have gained popularity. This trend suggests a growing awareness of environmental concerns and a preference for more sustainable transportation options.
Từ vựng quan trọng:
- Mode of transport: Phương tiện di chuyển
- Popularity: Phổ biến
- Decline: Giảm
- Usage: Sử dụng
- Steady rise: Tăng đều đặn
- Moderate increase: Tăng vừa phải
- Downward trend: Xu hướng giảm
- Sustainable: Bền vững
II. Bài mẫu IELTS Writing Task 1 Line graph – Đề 02
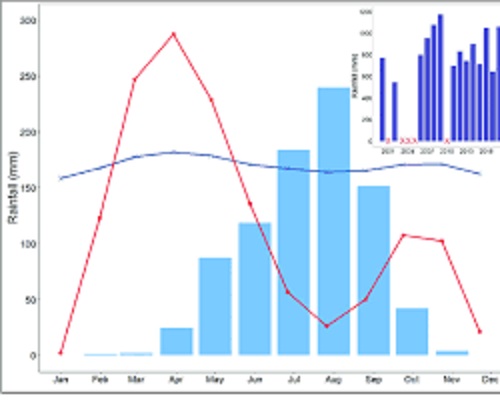
Đề bài: The line graph below illustrates the average monthly rainfall in a city between 2010 and 2020.
Bài mẫu:
The line graph depicts the average monthly rainfall in a city from 2010 to 2020. It reveals a distinct pattern of rainfall distribution, with higher precipitation during the wet season and lower rainfall during the dry season.
In 2010, the average monthly rainfall started at around 50 millimeters (mm) in January and gradually increased to reach a peak of 200 mm in July. The rainfall then declined steadily, reaching 50 mm again in December. This pattern persisted throughout the decade, with minor variations in the peak and trough values.
From 2010 to 2015, the average monthly rainfall during the wet season (June to September) remained relatively stable, with peak rainfall ranging between 180 mm and 220 mm. However, the dry season (October to May) experienced a slight decrease in rainfall, with average monthly values dropping from around 70 mm to 50 mm.
Between 2015 and 2020, the wet season continued to exhibit consistent rainfall patterns, with peak precipitation hovering around 200 mm. The dry season, on the other hand, witnessed a more noticeable decline, with average monthly rainfall values falling below 40 mm in some months.
In conclusion, the line graph demonstrates a consistent pattern of average monthly rainfall in the city from 2010 to 2020. The wet season consistently brought higher precipitation, while the dry season experienced a gradual decrease in rainfall. This pattern suggests a potential shift in the city’s climate, which could have implications for water resource management and agricultural practices.
Từ vựng quan trọng:
- Rainfall: Lượng mưa
- Precipitation: Lượng giáng thủy
- Wet season: Mùa mưa
- Dry season: Mùa khô
- Pattern: Mẫu
- Distribution: Phân bố
- Peak: Đỉnh điểm
- Trough: Vùng trũng
- Variation: Biến đổi
- Consistent: Ổn định
- Hovering: Dao động quanh
- Noticeable: Đáng chú ý
- Decline: Giảm
- Implication: Hệ quả
- Water resource management: Quản lý tài nguyên nước
- Agricultural practices: Hoạt động nông nghiệp
III. Bài mẫu IELTS Writing Task 1 Line graph – Đề 03
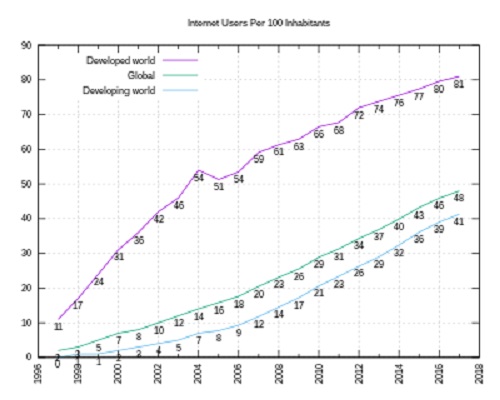
Đề bài: The line graph below shows the number of internet users in three different countries – the United States, China, and India – from 2010 to 2020.

Bài mẫu:
The line graph illustrates the remarkable growth of internet usage in the United States, China, and India between 2010 and 2020. While all three countries experienced significant increases, China stands out as the nation with the highest overall internet user base.
In 2010, the United States had the highest number of internet users, with approximately 250 million users. China followed closely with 220 million users, while India had a relatively smaller user base of 100 million.
Over the next five years, the number of internet users in all three countries witnessed a rapid surge. By 2015, the United States had reached 300 million users, China surpassed 350 million users, and India’s user base grew to 200 million.
From 2015 to 2020, the growth continued at an even faster pace. The United States reached 400 million users by 2020, while China’s user base skyrocketed to a staggering 800 million. India’s internet penetration also accelerated, with the number of users reaching 450 million in 2020.
In conclusion, the line graph highlights the exponential growth of internet usage in the United States, China, and India over the past decade. China emerged as the dominant player in terms of internet users, while all three countries demonstrated a strong commitment to bridging the digital divide and expanding internet access to their populations.
Từ vựng quan trọng:
- Internet user: Người dùng internet
- Remarkable growth: Tăng trưởng đáng kể
- Overall internet user base: Tổng số người dùng internet
- Witness a rapid surge: Tốc độ tăng trưởng nhanh chóng
- Skyrocket: Tăng vọt
- Digital divide: Khoảng cách kỹ thuật số
- Bridge the digital divide: Thu hẹp khoảng cách kỹ thuật số
IV. Bài mẫu IELTS Writing Task 1 Line graph – Đề 04
Đề bài: The line graph below illustrates the number of internet users in three different countries – Vietnam, China, and the United States – from 2010 to 2020.
Bài mẫu:
The line graph depicts the growth of internet users in Vietnam, China, and the United States between 2010 and 2020. It highlights the remarkable surge in internet penetration across all three countries, with China experiencing the most significant growth.
In 2010, Vietnam had the lowest number of internet users, with approximately 30 million, compared to 40 million in China and 250 million in the United States.
Over the next decade, all three countries witnessed a substantial increase in internet usage. Vietnam experienced the steepest growth, with the number of users reaching 120 million by 2020. China’s internet user base grew to 800 million, while the United States saw a moderate increase to 320 million.
China consistently maintained the highest number of internet users throughout the period, with its user base quadrupling between 2010 and 2020. Vietnam’s internet user base grew by a factor of four, while the United States experienced a modest growth of 28%.
In conclusion, the line graph demonstrates the rapid expansion of internet usage in Vietnam, China, and the United States from 2010 to 2020. China emerged as the frontrunner in terms of internet penetration, while Vietnam experienced the most significant growth rate. These trends reflect the growing importance of the internet in modern society and its transformative impact on communication, commerce, and information access.
Từ vựng quan trọng:
- Internet user: Người dùng internet
- Internet penetration: Tỷ lệ sử dụng internet
- Surge: Tăng đột ngột
- Remarkable: Đáng chú ý
- Substantial: Tăng đáng kể
- Steepest growth: Tốc độ tăng trưởng cao nhất
- Moderate increase: Tăng vừa phải
- User base: Cộng đồng người dùng
- Quadruple: Tăng gấp bốn lần
- Transformative impact: Tác động to lớn
V. Bài mẫu IELTS Writing Task 1 Line graph – Đề 05
Đề bài: The line graph below illustrates the annual rainfall in London, England, from 1980 to 2020.

Bài mẫu:
The line graph depicts the annual rainfall in London, England, over a period of four decades, from 1980 to 2020. It reveals a fluctuating pattern of rainfall, with a slight overall increase in precipitation levels.
In 1980, London experienced an annual rainfall of approximately 550 millimeters. Over the next two decades, rainfall levels fluctuated between 500 and 600 millimeters, with no discernible trend.
From 2000 onwards, a gradual upward trend emerged. By 2010, annual rainfall had reached 650 millimeters, and this trend continued throughout the following decade, with rainfall levels peaking at 700 millimeters in 2020.
It is noteworthy that the most significant increase in rainfall occurred between 2015 and 2020, when annual rainfall rose by 50 millimeters. This increase coincides with concerns about global climate change and its potential impact on weather patterns.
In conclusion, the line graph demonstrates a slightly increasing trend in annual rainfall in London from 1980 to 2020. While the overall increase is modest, the recent rise in precipitation levels raises concerns about the potential impact of climate change on the city’s weather patterns.
Từ vựng quan trọng:
- Annual rainfall: Lượng mưa trung bình năm
- Fluctuating pattern: Biểu đồ dao động
- Slight overall increase: Tăng nhẹ tổng thể
- Precipitation levels: Mức độ mưa
- Discernible trend: Xu hướng rõ ràng
- Gradual upward trend: Xu hướng tăng dần
- Peak: Đỉnh điểm
- Noteworthy: Đáng chú ý
- Significant increase: Tăng đáng kể
- Coincides with: Trùng hợp với
- Concerns about global climate change: Lo ngại về biến đổi khí hậu toàn cầu
- Potential impact: Tác động tiềm ẩn
- Weather patterns: Biểu đồ thời tiết
VI. Bài mẫu IELTS Writing Task 1 Line graph – Đề 06
Đề bài: The line graph below shows the average life expectancy in three different countries – Japan, Australia, and the United States – from 1990 to 2020.

Bài mẫu:
The line graph illustrates the trends in average life expectancy in Japan, Australia, and the United States between 1990 and 2020. It reveals a remarkable upward trend in life expectancy across all three countries, with Japan consistently maintaining the highest average life expectancy throughout the period.
In 1990, Japan had the highest average life expectancy, at 76 years, followed by Australia at 75 years and the United States at 73 years.
Over the next three decades, all three countries experienced a significant increase in life expectancy.exclamation Japan’s average life expectancy rose to 84 years by 2020, while Australia’s reached 83 years and the United States’ reached 80 years.
Japan consistently held the top position in terms of average life expectancy throughout the period, with its average life expectancy increasing by 8 years between 1990 and 2020. Australia’s average life expectancy increased by 8 years, while the United States’ increased by 7 years.exclamation
In conclusion, the line graph demonstrates a consistent upward trend in average life expectancy in Japan, Australia, and the United States from 1990 to 2020. Japan emerged as the frontrunner in terms of life expectancy, while all three countries made notable progress in improving health outcomes for their citizens. These trends highlight the positive impact of advancements in healthcare, technology, and living standards on human longevity.
Từ vựng quan trọng:
- Average life expectancy: Tuổi thọ trung bình
- Remarkable upward trend: Xu hướng tăng đáng kể
- Consistently maintain: Duy trì liên tục
- Significant increase: Tăng đáng kể
- Held the top position: Giữ vị trí dẫn đầu
- Notable progress: Tiến bộ đáng kể
- Health outcomes: Kết quả sức khỏe
- Human longevity: Tuổi thọ con người
Với tổng hợp các bài mẫu IELTS Writing Task 1 Line Graph được cung cấp trong bài viết này, hy vọng bạn đã có thêm nguồn tài liệu hữu ích để ôn luyện và đạt điểm cao trong kỳ thi IELTS. Hãy tiếp tục luyện tập thường xuyên và tham khảo thêm các tài liệu khác để hoàn thiện kỹ năng Writing Task 1 của bạn.


